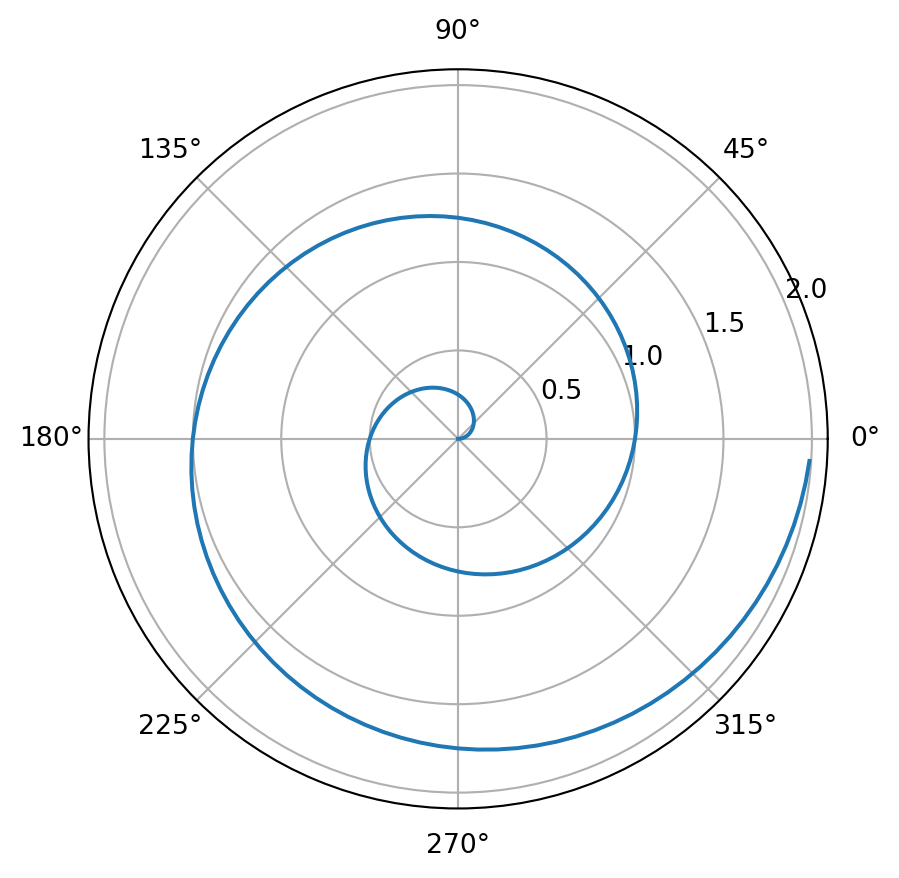
For a demonstration of a line plor on a polar axis, see ?@fig-polar.
Code
# label: fig-polar# fig-cap: "A line plot on a polar axis"import numpy as np;import matplotlib.pyplot as plt;r = np.arange(0, 2, 0.01);theta =2* np.pi * r;fig, ax = plt.subplots(subplot_kw = {'projection': 'polar'});ax.plot(theta, r);ax.set_rticks([0.5, 1, 1.5, 2]);ax.grid(True);fig.show();
/var/folders/lz/yrwb3j7j6gvb1jzytkq9b4x00000gp/T/ipykernel_71830/767464295.py:13: UserWarning:

Matplotlib is currently using module://matplotlib_inline.backend_inline, which is a non-GUI backend, so cannot show the figure.